This article first appeared in Data Science Briefings, the DataMiningApps newsletter. Subscribe now for free if you want to be the first to receive our feature articles, or follow us @DataMiningApps. Do you also wish to contribute to Data Science Briefings? Shoot us an e-mail over at briefings@dataminingapps.com and let’s get in touch!
Contributed by Yameng Guo, Seppe vanden Broucke and Qiuzhen Ren. Based on an accepted paper to be presented at CSAI 2024.
Key Take-Aways
- Managerial turnover is an important concern given the rising competition for talent retention
- Despite significant efforts to explore the impact of factors on turnover based on the current work experience, previous transition events of top managers as well as their co-workers have so far been underutilized
- We propose a heterogeneous graph to be used as the key input structure to analyse managerial turnover
- A carefully constructed architecture around heterogeneous graph neural network layers allows to extract interpretable insights as they relate both to graph elements as well as manager and company features
Introduction
Over the past decades, managerial turnover has gained increasing attention, especially with the rising competition for talent retention [1]. Top managers, being sources of long-term competitive advantage and crucial determinants of organizational performance, have garnered significant concern regarding their retention and turnover behaviour in the field of human resource management, from both academia and industry. Turnover of top managers can lead to substantial costs for organizations, including harming team stability, increasing firm-specific human capital loss and the risk of deterioration of performance [2]. Additionally, regaining and replacing talent can be very costly and could damage a firm’s future performance and hamper operational stability in terms of managerial routines and relationships. To mitigate these risks and costs, identifying and predicting potential turnover behaviour of top managers becomes essential for firms and their stakeholders to develop appropriate interventions to enhance their competitive advantage and prevent additional costs.
Predicting Managerial Turnover
Previous research has focused on predicting managerial turnover using traditional machine learning methods as well as deep neural network inspired techniques. However, despite significant efforts to explore the impact of factors on turnover based on the current work experience, i.e. the currently held position of a manager, previous transition events of top managers as well as their co-workers have so far been underutilized.
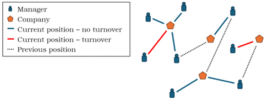
In our work, we propose a heterogeneous graph to be used as the key input structure to analyse managerial turnover, consisting of nodes representing top managers and nodes representing listed companies. An example is provided in the figure below:
This graph is heterogeneous because it encompasses more than one single node and edge type. Two node types, for the managers and companies respectively, are present. Edges are constructed based on historical employment information extracted over a certain time interval. Whenever a manager has worked in a company (but has since left it), an edge of type “previous” is added between the manager and company to denote a previous employment relationship. In case a manager is currently still employed at a company, a different edge type (“current”) is added between them. The latter edges carry the binary label we aim to predict in our setup, i.e. whether the manager will leave during a future period of observation (the edge would hence disappear and be replaced by a “previous” one), or whether the manager stays.
We constructed an instantiation of this graph based on a large data set containing firm and managerial characteristics, obtained from the China Stock Market & Accounting Research Database (CSMAR), a comprehensive research-oriented data-base focusing on finance and economy in China. Historical records indicating employment positions of top-managers throughout the past years are included. Apart from the graph topology described above, we also include node features consisting of demographic characteristics of manager and financial health variables relating to company nodes. Edge attributes related to compensation and other manager-company employment characteristics where added as well.
Heterogeneous Graph Neural Networks
Generally speaking, graph neural networks (GNNs) construct representational vectors for nodes in a graph by propagating messages (aggregating or concatenating neighbouring node features) throughout the entire graph between a node and its neighbours. As such, layers in a GNN model apply a generalized version of the standard grid-like convolution operator which can be applied to irregular (non-grid like) domains, where it is then typically denoted as neighbourhood aggregation or message passing.
When working with heterogeneous graphs, this approach needs to be modified. Heterogeneous graphs come with different types of information attached to nodes and edges. Thus, a single node feature representation would not suffice for all nodes, due to differences in type and dimensionality. Consequently, the message passing formulation changes to be dependent on node or edge type. This adjustment retains flexibility in terms of convolutional kernel selection, and indeed allows for each edge type to utilize a different aggregation and extraction scheme.
Building on top of the concept of heterogeneous GNNs, we construct a complete architecture as shown below:
Results
We experimented with different heterogeneous GNN layers in our setup: GraphSAGE [3], Graph Attention Networks (GAT) [4] and Heterogeneous Graph Transformers (HGT) [5], to offer a representative selection of available GNN encoding layers for heterogeneous networks. In our comparative setup, HGT performed best, obtaining a top-decile lift score of 1.463.
Particularly appealing is the notion that different interpretability techniques can be combined to gain more insights into the underlying patterns of top management turnover. Although many traditional interpretability techniques fall short in terms of being able to incorporate graph information in order to explain the importance of edges and nodes, a number of specific interpretability techniques to be utilized with GNNs has been proposed in recent years, including GNNExplainer [6] and PGExplainer [7]. We leverage the concept of “integrated gradients”, an explanatory technique which is capable to attribute the prediction of a deep learning network to the inputs it receives [8]. Although this is a straightforward technique, it is challenging to use it in a context where the input consists of a graph structure. Therefore, to meet the need towards interpreting the impact of both nodes, edges, and their attributes, we utilize the deliberately set-up architecture intruded above in a manner which allows us to apply gradient integration on two levels. First, on the inputs of the graph neural network encoder, using the full model, which provides us with attribution scores for the node features and edge types. To obtain the attribution scores for each edge attribute, we start before the concatenation operator and keep the indexed outputs of the graph neural network fixed and integrate the gradients over the edge features input.
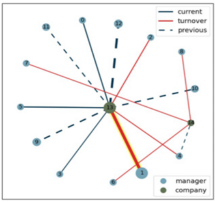
This allows us to extract attribution scores for each node and its features, each edge, and each edge attribute towards the prediction of a single instance, which can be aggregated to provide summarized model-level insights but can also be inspected per instance to get individual explanations. A graph-level explanation can be found below, explaining the prediction of a single instance:
The figure shows the sub-graph around an instance edge of interest (highlighted in yellow) , including other managers that work or worked at the same company and the companies they moved towards. Larger node sizes and thicker edge widths signify greater attributions to the prediction. Red and green colours correspond with positive and negative attribution accordingly.
What is very notable is that previous working relationships show a high importance in terms of predicting turnover, indeed underscoring the importance of incorporating previous work experiences into predictive setups and emphasizing the social effect in terms of understanding managerial churn
References
- [1] Thomas Hugh Feeley, Jennie Hwang, and George A. Barnett. 2008. Predicting Employee Turnover from Friendship Networks. Journal of Applied Communication Research 36, 1 (Feb. 2008), 56–73
- [2] George A Boyne, Oliver James, Peter John, and Nicolai Petrovsky. 2011. Top management turnover and organizational performance: A test of a contingency model. Public Administration Review 71, 4 (2011), 572–581.
- [3] Will Hamilton, Zhitao Ying, and Jure Leskovec. 2017. Inductive representation learning on large graphs. Advances in neural information processing systems 30 (2017).
- [4] Petar Veličković, Guillem Cucurull, Arantxa Casanova, Adriana Romero, Pietro Lio, and Yoshua Bengio. 2017. Graph attention networks. arXiv preprint arXiv:1710.10903 (2017).
- [5] Ziniu Hu, Yuxiao Dong, Kuansan Wang, and Yizhou Sun. 2020. Heterogeneous graph transformer. In Proceedings of the web conference 2020. 2704–2710.
- [6] Zhitao Ying, Dylan Bourgeois, Jiaxuan You, Marinka Zitnik, and Jure Leskovec. 2019. Gnnexplainer: Generating explanations for graph neural networks. Advances in neural information processing systems 32 (2019).
- [7] Dongsheng Luo, Wei Cheng, Dongkuan Xu, Wenchao Yu, Bo Zong, Haifeng Chen, and Xiang Zhang. 2020. Parameterized explainer for graph neural network. Advances in neural information processing systems 33 (2020), 19620–19631.
- [8] Mukund Sundararajan, Ankur Taly, and Qiqi Yan. 2017. Axiomatic attribution for deep networks. In International conference on machine learning. PMLR, 3319–3328


