
This article first appeared in Data Science Briefings, the DataMiningApps newsletter. Subscribe now for free if you want to be the first to receive our feature articles, or follow us @DataMiningApps. Do you also wish to contribute to Data Science Briefings? Shoot us an e-mail over at briefings@dataminingapps.com and let’s get in touch!
Contributed by Elena Tiukhova.
Education plays a critical role in the lives of billions of people around the world. Therefore, optimizing educational processes and improving the learning experience is of paramount importance to all stakeholders, including learners, teachers, administrators, and researchers. Advances in AI and data analytics are creating new opportunities in education, collectively referred to as educational data mining (EDM). EDM involves applying data mining, machine learning, and statistical techniques to learner-generated data to improve learning outcomes. Another term related to EDM is learning analytics (LA), which is defined as the collection and analysis of data about learners and learning environments to optimize learning processes [1].
The insights generated by EDM and LA should be actionable, i.e. they should be effectively delivered to the relevant parties, e.g. students or teachers. Since most educational stakeholders are not analytics experts, effective interpretation of these insights depends heavily on how they are presented. Visual Learning Analytics (VLA) aims to meet this need by visualizing the insights provided by LA and EDM techniques, and multiple visualizations can be combined to create a Learning Analytics Dashboard (LAD).
Teacher side of education: instructional design
Instructors (e.g. teachers) are the main drivers of the educational process. When planning their educational activities, they often adopt a systematic theory or model-driven approach, supported by technology, a process known as Instructional Design (ID) [2]. The way instructional design is approached has a major impact on the learning experience. To enhance ID, it can be supported by technology, and EDM and LA offer many ways to do this. For example, LADs that visualize learning trends and student data can potentially be useful to teachers in their ID tasks. It is then important to understand how LADs can be designed to effectively support these activities.
Theory-informed solution
As straightforward as the LA process may seem, i.e. getting the learning data, applying the data mining technique and visualizing it, it is important to consider grounding instructional design in theoretical models to stay consistent with pedagogy. The same goes for learning analytics dashboards, and existing solutions often neglect learning sciences when designing visualizations. In terms of instructional design theories, there are many models that can potentially guide the instructional process. For example, the model developed by Gerlach & Ely [3] defines the determinants of such ID tasks as determining the instructional strategy, organizing student groups, allocating time and space, and selecting learning resources. According to Gerlach & Ely, the design of these tasks is determined by various factors such as course content and objectives, students’ prior knowledge and skills, and performance and feedback from previous course runs. What else might help an instructor design these tasks? Our suggestion is the assessment of student behavior, which can be effectively achieved by incorporating a learning analytics dashboard for instructors.
Learning analytics dashboard for teachers
We are working in the context of a higher education institution in Belgium. Specifically, we collected the log data from the learning management system used by the first year bachelor students at the Faculty of Economics and Business in the academic year 2020-2021. Based on Gerlach & Ely’s ID model, we identified feasible instructional design tasks – those tasks that an instructor has the authority to modify. In our use case, these tasks are determining the instructional strategy, allocating time, and selecting learning resources. Based on the data availability and relevant literature on the VLA and LAD, we developed a list of learning indicators that we could design from the raw log data. Consequently, we designed three dashboard pages with the visualizations using the learning indicator data and hypothesized the mapping of the dashboard pages to the instructional design tasks:

Does it really help in the end?
In order to evaluate how well we positioned the dashboard in the instructional design model and how useful it is in performing the above mentioned tasks, we interviewed six university teachers. Based on their responses, we refined the positioning of the dashboard pages with respect to the instructional design tasks and gathered useful feedback for future dashboard improvements and other potential use cases for the developed solution:
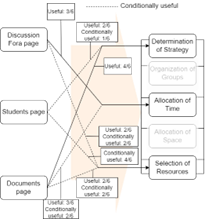
We were able to confirm most of the hypothesized relationships, distinguishing between conditional and unconditional usefulness based on the responses. Looking at the proposed dashboard without further modifications, the task of determining teaching strategy is supported by the Documents page, while the task of allocating time is supported by the Discussion Forums page. With some modifications, the former task is also supported by the Students page, while the latter task is supported by the Documents page. The task of selecting learning resources is conditionally supported by all dashboard pages. All in all, 7/8 of the hypothesized directions of dashboard-to-ID task mapping are confirmed, two of them unconditionally. Respondents also mentioned that the scope of the dashboard can be further extended to support other pedagogical activities, such as student activation, intervention, or feedback provision.
What is next?
Thanks to the design science approach, feedback gathered during the dashboard’s prototype phase helps to improve it in future iterations. New visualizations such as duration statistics will be added, as well as enhancements to existing visualizations such as more granular activity and advanced filtering. New data sources such as summative assessment grades will also be considered. Finally, the currently limited scope of bachelor courses will be expanded to include more flexible master’s level programs.
References
[1] Siemens, G., Long, P.: Penetrating the fog: Analytics in learning and education. EDUCAUSE review 46(5), 30 (2011)
[2] Saçak, B., Bozkurt, A., Wagner, E.: Learning design versus id: A bibliometric study through data visualization approaches. Educ. Sci. 12(11), 752 (2022)
[3] Gerlach, V.S., Ely, D.P.: Teaching and media: A systematic approach. Prentice-Hall (1980)