By: María Óskarsdóttir, Jan Vanthienen, Seppe vanden Broucke, Bart Baesens
This article first appeared in Data Science Briefings, the DataMiningApps newsletter. Subscribe now for free if you want to be the first to receive our feature articles, or follow us @DataMiningApps. Do you also wish to contribute to Data Science Briefings? Shoot us an e-mail over at briefings@dataminingapps.com and let’s get in touch!
In today’s dynamic society almost everyone owns a cell phone and therefore has a contract with a telco provider. The providers offer different benefits which means that people tend to change from one to another to get the best deal. This is expensive for the providers, who prefer to keep the relationships with their current clients, and therefore offer promotions as a strategy not to loose them.
However, not everyone is at risk of leaving and offering promotions all around can be expensive. Instead of doing so, the providers hence try to identify the clients that are most likely to leave and become churners. This is done by analysing the clients’ characteristics, such as demographic information, usage behaviour and cell phone features, so as to build churn prediction models.
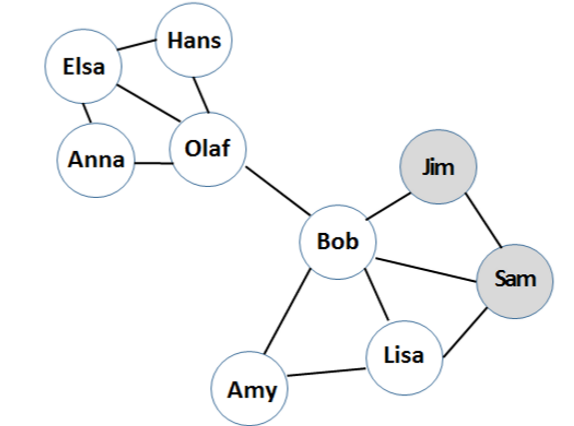
A main drawback of this method is that users are assumed to be independent of each other. In reality, that is not the case at all. Especially in the telco industry, where a caller’s behaviour is very much dependent on the behaviour of the people he talks to the most. To illustrate this, look at the network in the figure below: Bob calls his friends, Sam and Jim, very frequently and they all used to have contracts with the same telco provided. Then, one day, Sam and Jim decided to switch providers. What will Bob do? Is he likely to also change providers or does he decide to stay because he has other friends who did not churn?

At this point Bob has two neighbors who are churners and three (Lisa, Amy and Olaf) that are not. Counting the types of neighbors a client has, is one of many network variables which can be mined from the call graph and incorporated in the churn prediction model to give more accurate results. The call graph is constructed using phone call records, collected by the telco providers, and is one form of a social network.
Networks arise in many data mining applications. They are used to represent connections between objects, for example, communication, financial transaction and links between websites. It is clear that such networks can be very large and at a first glance quite unorganized. It is the job of a data analyst to discover structure and patterns in the network to gather information that is of value. This is not a straight forward task given the enormity of the networks.
Intuitively, there exist groups of objects that have many connections between them and few connections to other groups. For example, on a website with cooking recipes there are many links to other sites with recipes and not that many to websites that sell cars. These groups are known as communities and the process of finding them is called community detection.
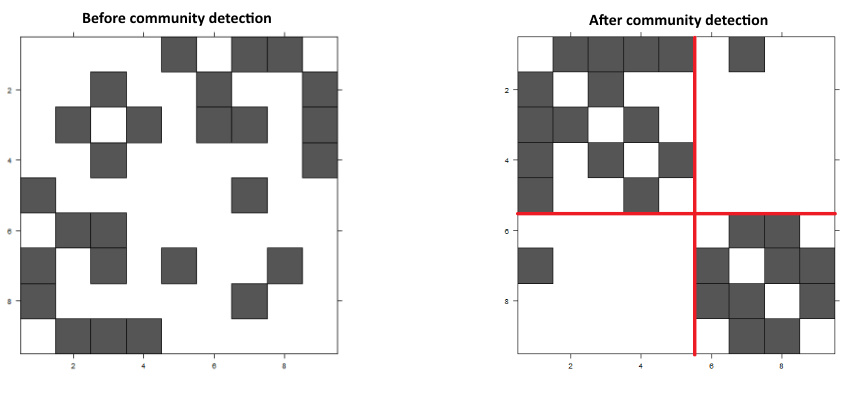
Networks are also represented by matrices, where each object is assigned a row and a column and a link in the network is a unit in the matrix. These matrices are usually quite empty, or sparse, with only a few non zero entries, that seem randomly scattered around the matrix.
To discover the communities, the matrices are manipulated by swapping rows and columns according to some rule to bring objects that are highly connected closer together. There are many ways to approach this, one of them is the Fully Automatic Cross Associations algorithm [1] which finds the optimal number of communities in the network. It can be applied to call graphs to discover communities of people that call each other a lot.
As can be seen in the graph in the figure above, Bob is connected to two communities, the one with Amy, Lisa, Sam and Jim and also to Olaf and his contacts. The figure below shows the adjacency matrix of the call graph before and after community detection:
In the image on the right, it is clear that there are two communities, with one link between them. If we ignore this link and consider each community separately, the values of the network variables change. To illustrate this, look again at Bob. Before the community detection he had three neighbors that had not churned, but after the community detection, he has two, because the link between him and Olaf no longer exists. This change affects the churn prediction models and in our research, we have shown that eliminating connections between communities enhances the accuracy of the models.
From our study, we can conclude that cutting cords between communities is beneficial and that some connections are in fact redundant when building churn prediction models. By applying community detection methods to call graphs before extracting network features, we can boost the performance of the models because the people inside each community are more similar and more connected to each other than to people outside them.
To summarize this article, we state that:
- Telco companies want to successfully identify future churners so they can persuade them to stay by offering them promotions.
- Using information form the call network gives more accurate results.
- By clustering the call network, communities of customers can be detected.
- Analysing each community separately enhances churn predictions.
We are happy to discuss our research and hear your comments and ideas. Please contact us in case you wish to comment or leave feedback.
References
- Chakrabarti, S. Papadimitriou, D. S. Modha, and C. Faloutsos. Fully automatic cross-associations. In Proceedings of the tenth ACM SIGKDD international conference on Knowledge discovery and data mining, pages 79–88. ACM, 2004
- Verbeke, D. Martens, and B. Baesens. Social network analysis for customer churn prediction. Applied Soft Computing, 14:431–446, 2014

